plot_modeshape command
- vfo.plot_modeshape(model='none', modenumber=1, scale=10, setview='3D', contour='none', contourlimits=None, line_width=1, filename=None)
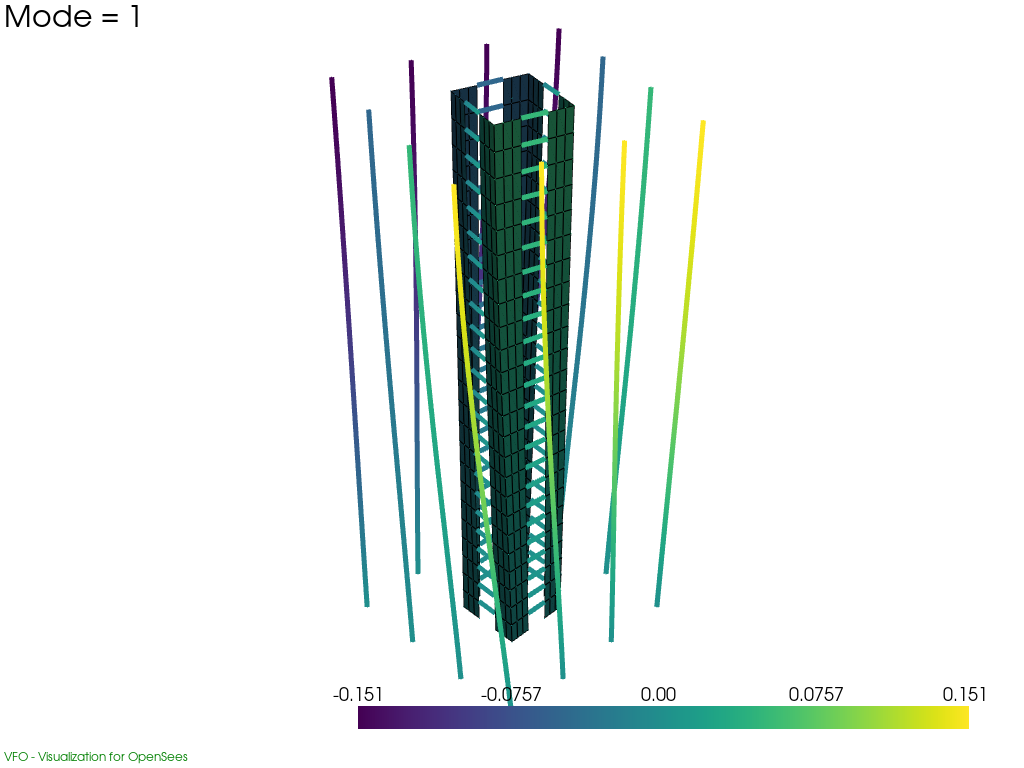
Any modeshape can be visualized using this command. There is no need to perform an eigen analysis exclusively since the command runs an eigen analysis internally.
model(str)name of the model output database as used in createODB() function. If no name is provided, the function tries to get data from the active model. Default is “none”. (optional)
modenumber(int)Mode number to visualize. For example: plot_modeshape(modenumber=3).
scale(float)Scale factor for to display mode shape. (optional, default is 10)
setview(str)Sets the camera view to predefined angles. Valid entries are “xy”,”yz”,”xz”,”3D”, or a list with [x,y,z] unit vector. Default is “3D”. (optional)
contour(str)Contours of displacement in x, y, or z. Default is “none”. (optional)
contourlimits(list)A list of minimum and maximum limits of the displacement contours. (optional)
line_width(float)Line width of the rendered elements. (optional)
filename(str)Filename to save an image of the modeshape. (optional)
Example:
vfo.plot_modeshape(modenumber=1, scale=300)Displays the 3rd modeshape using data from the active OpenSeesPy model with a scale factor of 300. This command should be called from an OpenSeesPy model script once the model is completed. The model should successfully work for Eigen value analysis. There is no need to create a database with createODB() command to use this option.
vfo.plot_modeshape(modenumber=1, scale=300, model="3D_Building")Displays the 3rd modeshape using data from 3D_Building_ODB database with a scale factor of 300. This command can be called from cmd, Ipython notebook or any Python IDE. An output database using createODB() has to be present in the current directory to use this command.