plot_model command
- vfo.plot_model(model='none', show_nodes='no', show_nodetags='no', show_eletags='no', font_size=10, setview='3D', elementgroups=None, line_width=1, filename=None)
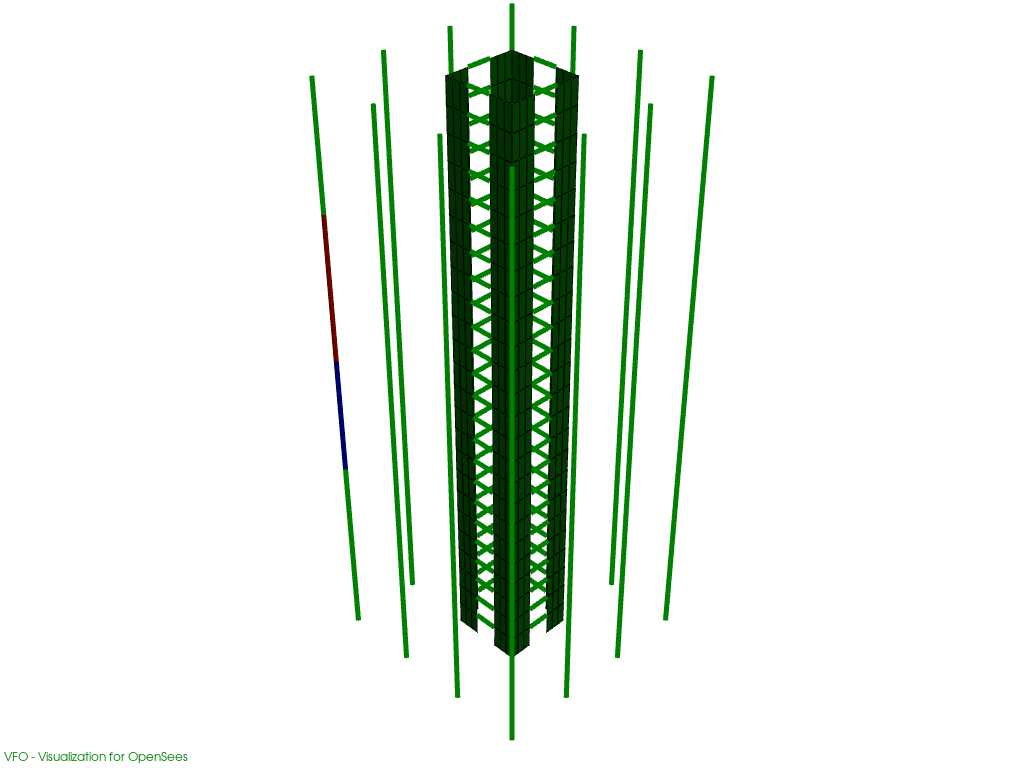
Once the model is built, it can be visualized using this command. By default Node and element tags are not displayed. No analysis is required in order to visualize the model.
To visualize an OpenSees model from an existing database (using
createdODB()command), the optional argument model=”ModelName” should be used. The command will read the model data from folder ModelName_ODB.model(str)name of the model output database as used in createODB() function. If no name is provided, the function tries to get data from the active model. Default is “none”. (optional)
show_nodes(str)Renders nodes as spheres if “yes”. Default is “no”. (optional)
show_nodetags(str)Displays node tags if “yes”. Default is “no”. (optional)
show_eletags(str)Displays element tags if “yes”. Default is “no”. (optional)
font_size(int)Size of tag font. Default is 10. (optional)
setview(str)sets the camera view to predefined angles. Valid entries are “xy”,”yz”,”xz”,”3D”, or a list with [x,y,z] unit vector. Default is “3D”. (optional)
elementgroups(list)List of lists of elements of groups and respective colors. See example below. (optional)
line_width(float)Line width of the rendered elements. (optional)
filename(str)Filename to save an image of the modeshape. (optional)
Input arguments to diaplay node and element tags can be used in any combination.
vfo.plot_model()Displays the model using data from the active OpenSeesPy model with no node and element tags on it.
vfo.plot_model(show_nodetags="yes")Displays the model using data from the active OpenSeesPy model with only node tags on it.
vfo.plot_model(show_eletags="yes")Displays the model using data from the active OpenSeesPy model with only element tags on it.
vfo.plot_model(show_nodetags="yes",show_eletags="yes")Displays the model using data from the active OpenSeesPy model with both node and element tags on it.
vfo.plot_model(model="ModelName",show_nodetags="yes")Displays the model using data from an existing database “ModelName_ODB” with only node tags on it.
vfo.plot_model(elementgroups=[[[1,2,3],[10,11]],["red","blue"]])Displays the model using data from the active model with elements [1,2,3] in “red” and elements [10,11] in “blue” colors.